Implement Graph Charts in Angular using chart.js

A Frontend Engineer by profession, with an eagerness to learn and adapt with full stack technology domain along with my current expertise! I am either way too curious or way too disinterested! Nothing in between! Social connects: Hashnode, LinkedIn, GitHub
Charts.js is an open source JavaScript library which allows us to include responsive charts in our application. We can add packages to our charts, being one of them named as ng2-charts, in order to combine chart.js with Angular. Adding the package gives us the leverage and access to Angular directives with which we can include charts using the chart.js library.
Let us now lay emphasis on how we can implement graphical representations or charts using chart.js with the help of ng2-charts. We will be creating a sample chart for our Angular project by going through each step in an orderly fashion:
Step 1: Setting up the project
As a prerequisite, we will be needing the following:
a) NodeJS to be installed locally in our machine
b) Some familiarity with setting up an Angular project and usage of its components.
In our node terminal window, we will use the following command
npx @angular/cli new angular-chartjs --style=css --routing=false --skip-tests
This will ensure that our project is established using CSS styling, including no routing and skipping tests.
Next, we will navigate through our newly created project directory:
cd angular-chartjs
We will then run the following command to install chart.js and ng2-charts dependency:
npm install chart.js@2.9.4 ng2-charts@2.4.2
Now we will be adding chart.js into our Angular.json file inside the scripts in our code editor:
{
//...
"root": "",
      "sourceRoot": "src",
      "prefix": "app",
      "architect": {
        "build": {
          "builder": "@angular-devkit/build-angular:browser",
          "options": {
            "outputPath": "dist/angular-chartjs",
            "index": "src/index.html",
            "main": "src/main.ts",
            "polyfills": "src/polyfills.ts",
            "tsConfig": "tsconfig.app.json",
            "aot": true,
            "assets": [
              "src/favicon.ico",
              "src/assets"
            ],
            "styles": [
              "src/styles.css"
            ],

        "scripts": [
              "node_modules/chart.js/dist/Chart.min.js"
            ],
            "allowedCommonJsDependencies": [
              "chart.js"
            ]
          },
//...
}
Then we will open app.module.ts in our code editor to include ChartsModule as imports:
import { NgModule } from '@angular/core';
import { BrowserModule } from '@angular/platform-browser';
import { ChartsModule } from 'ng2-charts';

import { AppComponent } from './app.component';

@NgModule({
  declarations: [
    AppComponent
  ],
  imports: [
    BrowserModule,
    ChartsModule
  ],
  providers: [],
  bootstrap: [AppComponent]
})

export class AppModule { }
With our initial template set up and good to go, we will now start with creating charts in the next steps.
Step 2: Creating a chart component
We will be using baseChart directive, as provided by ng2-charts, inside our HTML canvas element, We will be modifying the canvas to pass chartType and legend as attributes:
<div style="width: 70%;">
<canvas
  baseChart

  [chartType]="'bar'"
  [legend]="true"
  >

</canvas>


</div>
Note: the chartType attribute can use line, pie, doughnut, radar and other charts depending on what style of chart we want for our project. The legend attribute here is a boolean value.
Next open app.component.ts to define an array which we referenced in our template:
chartData = [
    {
      data: [34, 56, 15, 89, 78],
      label: 'Essence'
    },
    {
      data: [45, 23, 10, 20, 33],
      label: 'Software'
    },
    {
      data: [38, 10, 47, 80, 23],
      label: 'Developers'
    },
    {
      data: [67, 12, 78, 80, 89],
      label: 'Analytics'
    },
    {
      data: [45, 18, 76, 20, 59],
      label: 'Blogs'
    }

  ];
Now lets visit our app.component.html and modify the canvas to pass in labels and options:
<div style="width: 70%;">
<canvas
  baseChart

  [chartType]="'bar'"
  [legend]="true"
  [labels]="chartLabels"
  [options]="chartOptions"
  >

</canvas>

</div>
Now we will re-visit app.component.ts to define the object which we referenced in our template. We can refer to https://www.chartjs.org/docs/latest/configuration/ for available options:
chartOptions = {
    responsive: true
};
Now we will re-compile our application to see how it looks with graph inclusion:
npm start
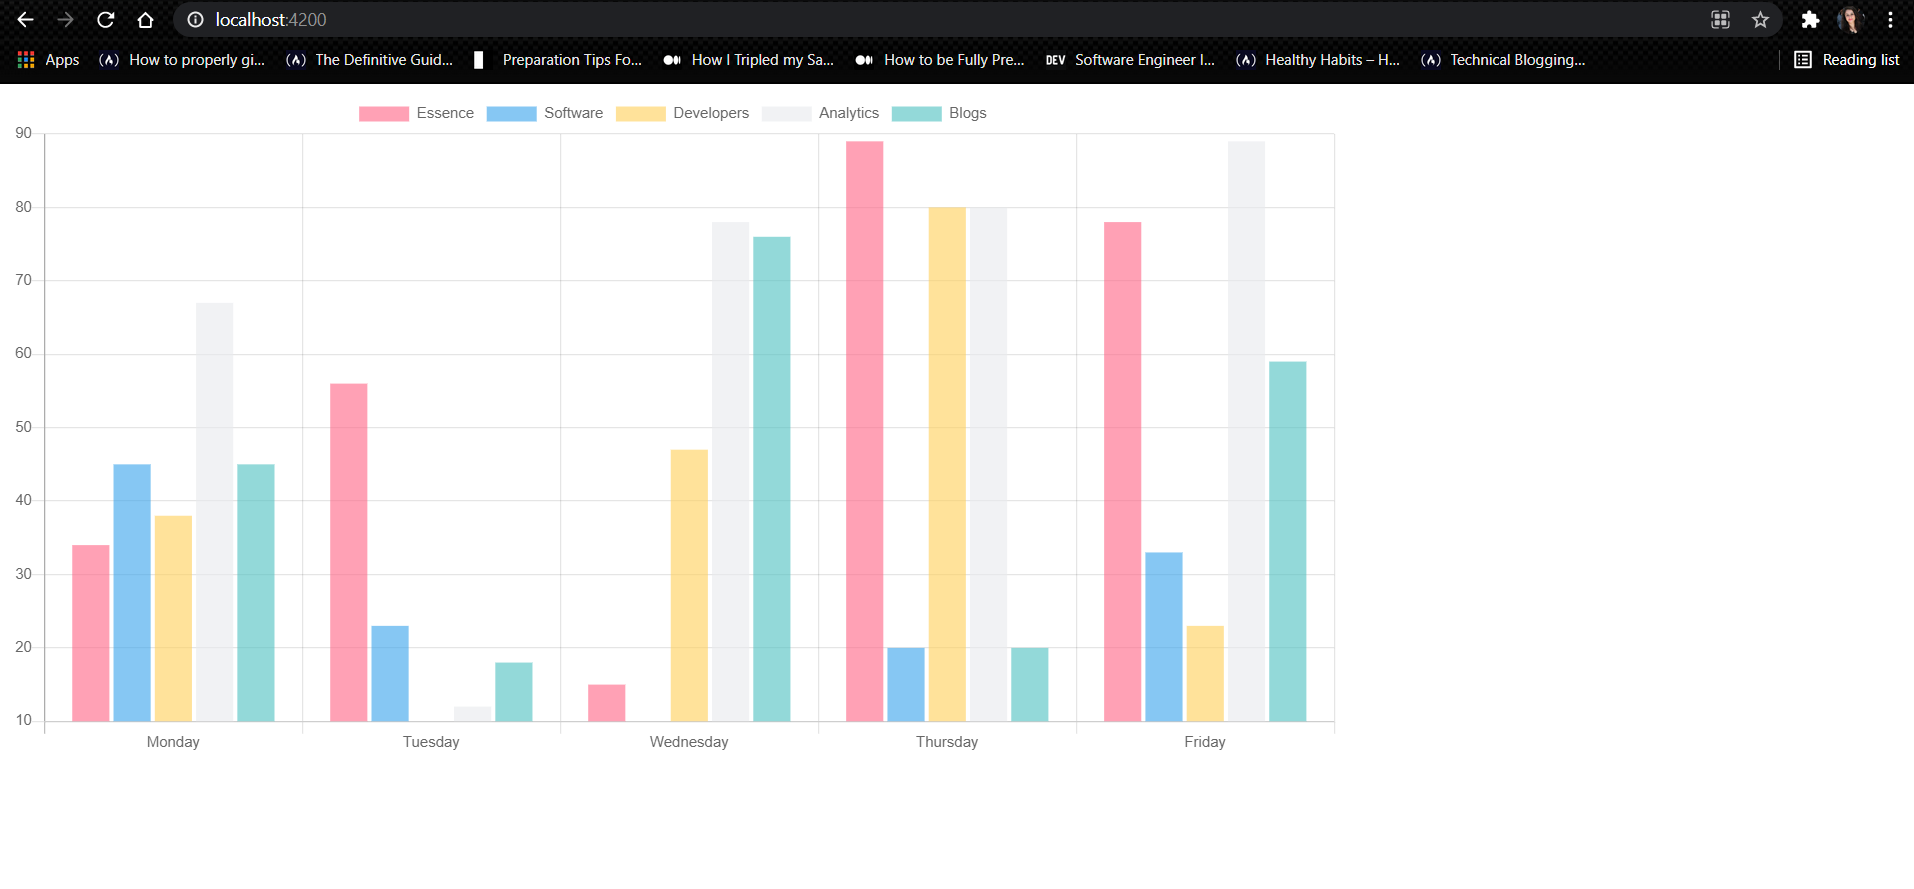
While viewing our application in the browser, typically [http://localhost:4200/], we will observe a graph plotted as below over the days of Monday, Tuesday, Wednesday, Thursday and Friday:
Conclusion
As of now, I just wanted to focus upon how we can create our own charts in Angular for our project, but there are several functionalities involved which we can further implement when we need to respond to data coming from the backend. One of them is updating datasets dynamically in our chart.
While exploring Charts.js library along with the combination of ng2-charts, I believe it is a great way to present our data interactively which looks modern and customisable.
Hope we all were able to learn something new together and use it to build our graphical representation in Angular.
Happy learning!


