Google I/O Adventure 2021 || Angular Dev Tools
My Exploration & Insights

A Frontend Engineer by profession, with an eagerness to learn and adapt with full stack technology domain along with my current expertise! I am either way too curious or way too disinterested! Nothing in between! Social connects: Hashnode, LinkedIn, GitHub
Google I/O developer conference has always been one of the most exciting and awaiting events for every tech enthusiast who has laid a step forward to get creative, learn and engage with other developers, to experience new innovative technologies.
Due to the ongoing Covid-19 pandemic, Google I/O commenced virtually this year from 18th - 20th May 2021, through video live streams and many registered attendees got to witness various announcements and innovations for all of the Google technologies - Android, Web, AI/ML, Firebase, Google Cloud & Maps Platform, to be naming a few.
I would now like to draw your attention towards two events which I got to discover myself and share their insights as follows:
Google I/O Adventure
I chanced upon the opportunity this time to witness the Google I/O Adventure, which is categorized as a virtual sandbox and a digital space. I got to see product demos, create avatar features, earn profile badges and virtual swags.
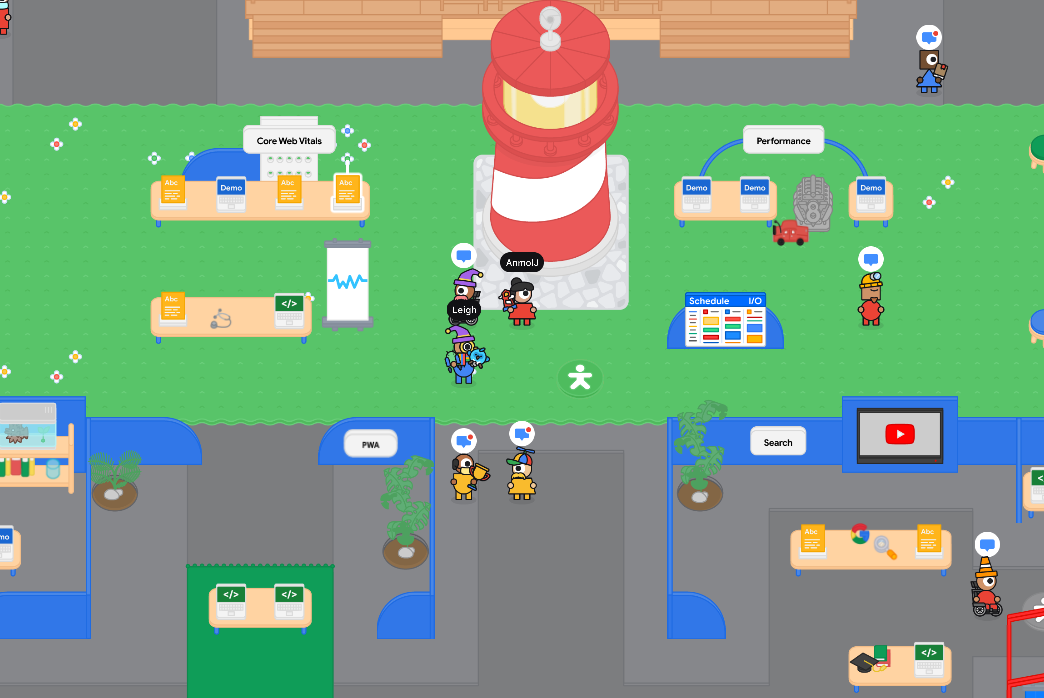
As through my image shared, I got to create an avatar of my own along with the customization. The avatar creation is done before we are introduced to the digital space environment. It had been a pleasant experience to come across a virtual digital sandbox model, having an interactive interface along with a clustered layer of character animations and avatars posing as attendees of the I/O Adventure.
Kudos to the entire I/O team at Google for their strenuous efforts to deliver an enriching look & feel of their products to the end-users.
Angular Dev Tools
I have been working on Angular for quite a while now, in terms of project building and deliverables at my organization, along with some learnings outside work hours. I have been excited to lay my hands on Angular Dev Tools from the time when it was officially announced at the Google I/O. I would like to share my insights as below:
Angular Dev Tools is a Chrome extension that allows us to perform debugging and inspection for our applications. These dev tools are supported with Angular v9 version and above, along with Ivy enabling capabilities. You can install the extension here from Chrome Dev Store.
Below are some features which are focussed upon its current release:
- Inspect and explore application structure
- Visualize component properties
- Profile our application
- Understand change detection execution
- Update property value
After installing Angular Dev Tools, we can explore the extension under the Angular tab in developer tools. We also get to see the extension being displayed at the top towards the right side of the address bar on the Chrome browser. There it indicates whether a specific website has access to the dev tools or not.
To understand its implementation, I took a screenshot of the current project I am working on. There we can then open our developer tools and inspect them as shown in the image below:
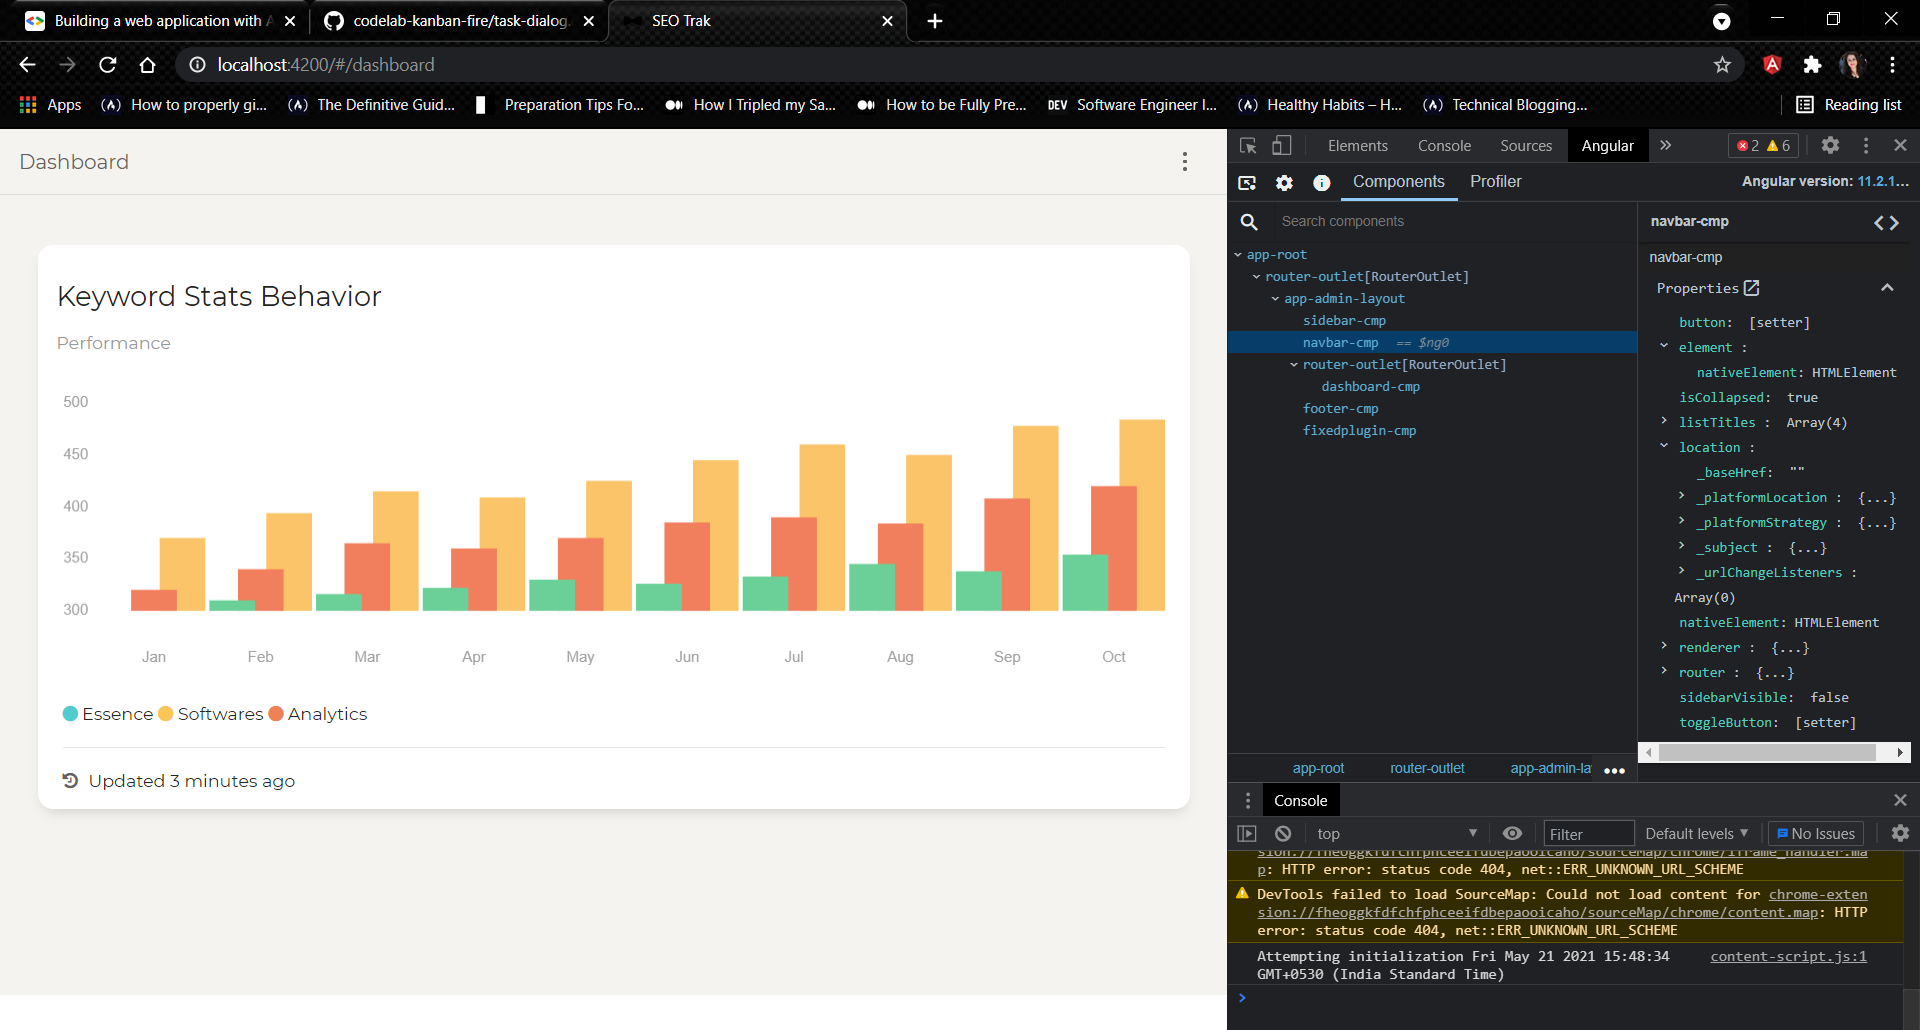
Furthermore, when we open the extension, we get to see two additional tabs as displayed in my image. Along with the tabs, the Angular Dev Tools version gets displayed as well. Let's understand what those are along with their functionality:
Components - This allows us to discover the components and the directives in our application where we get to know their properties along with previewing and editing their state.
Profiler - This allows us to discover and preview change detection and lifecycle hooks for our Angular application. A change detection gets carried out where Angular can detect data modifications for a component and then render the view automatically to detect those modifications. Profiling is also considered a process that takes place to seize the execution of events.
Profiler Implementation Of An Application

In the above image, we can see a bar sequence where each one of them is depicting a change detection cycle which helps us to find out the performance of our application. The taller the bar is, the longer our application has spent in the cycle process. We can even select a specific bar to check out the components and directives that have been captured in the cycle, along with the time taken for each bar.
In short, we come to know how much time Angular has spent in the cycle. Profiling as a dev tool estimates this time frame and indicates how our application can impact the user experience.
Import Profiler Recording
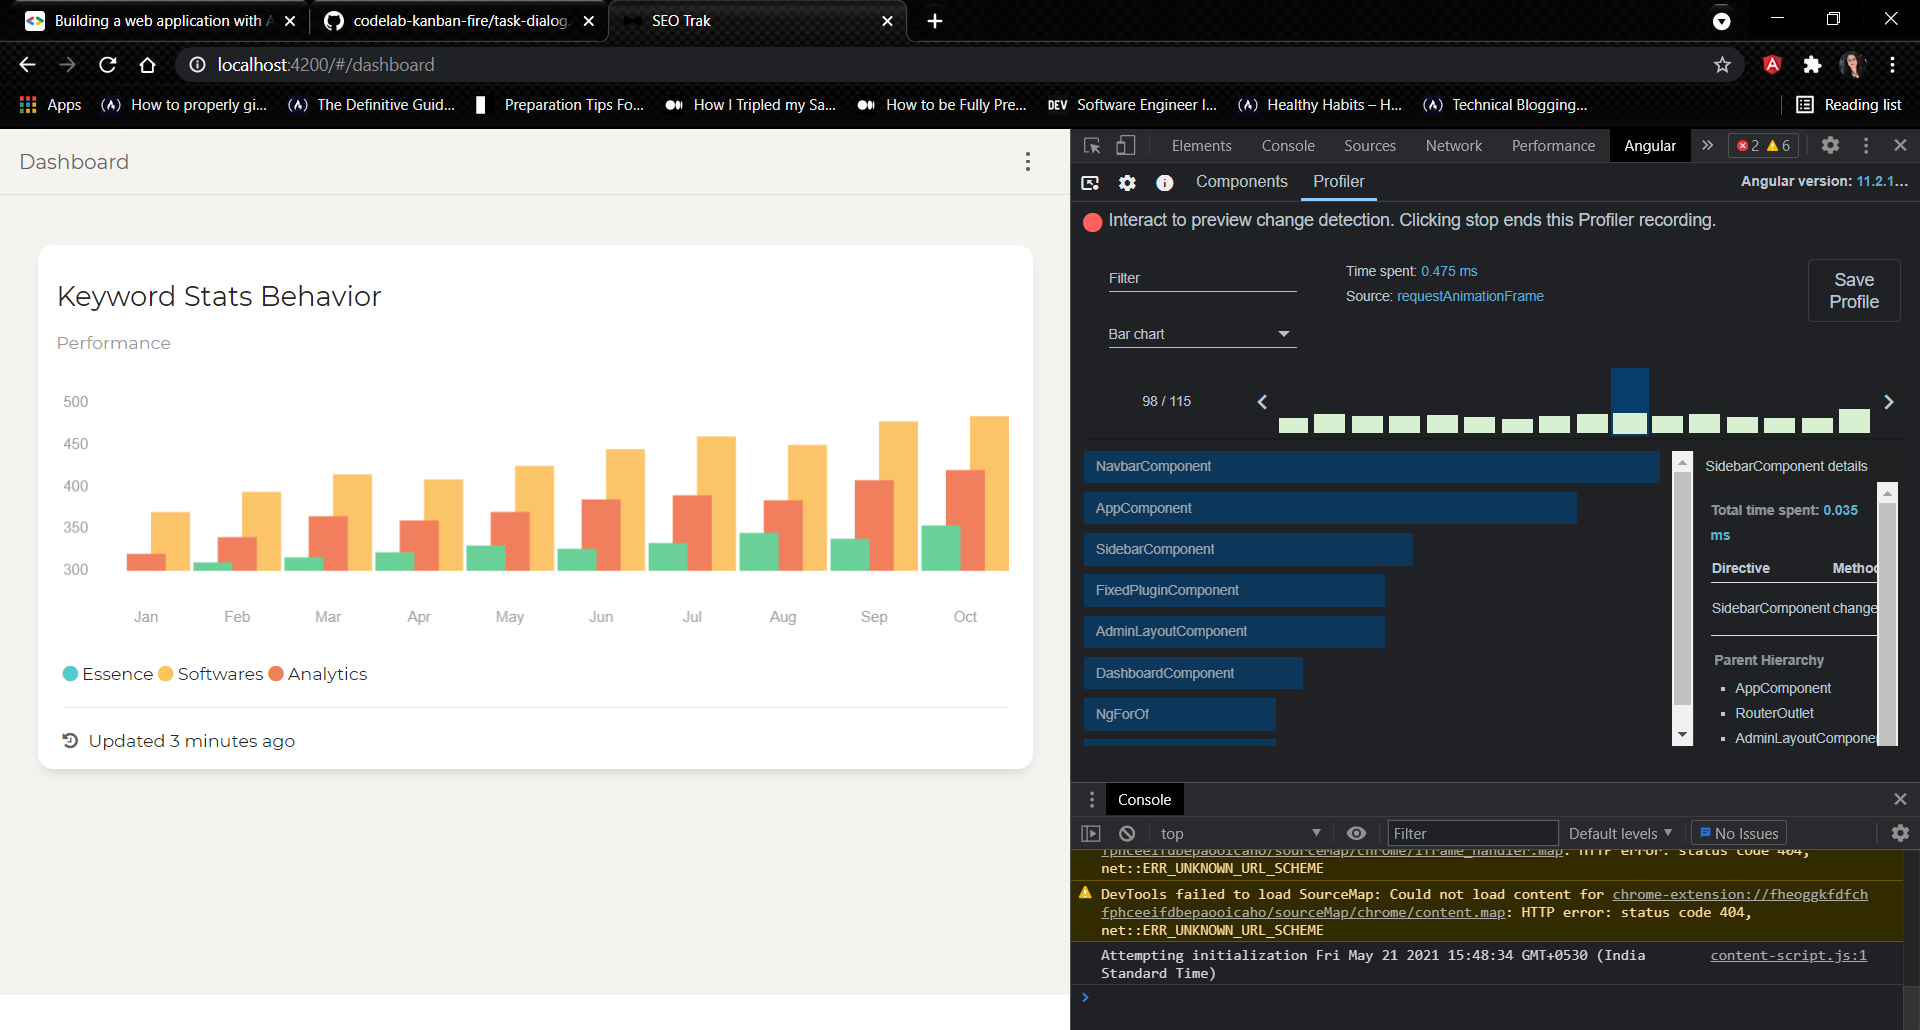
We then click on the Save Profile button to record the profiling session to export it as a JSON file. When the profiler is in its initial view, we can then import the file by clicking on Choose File input. In the end, we stop our recording or click on refresh to clear the current recording.


